
Develop, review, debug, and ship self‑healing code.

Let agents run for hours on multi-milestone plans. Stop only when the CI passes. Launch dozens of more parallel tasks than what’s possible with git worktrees.
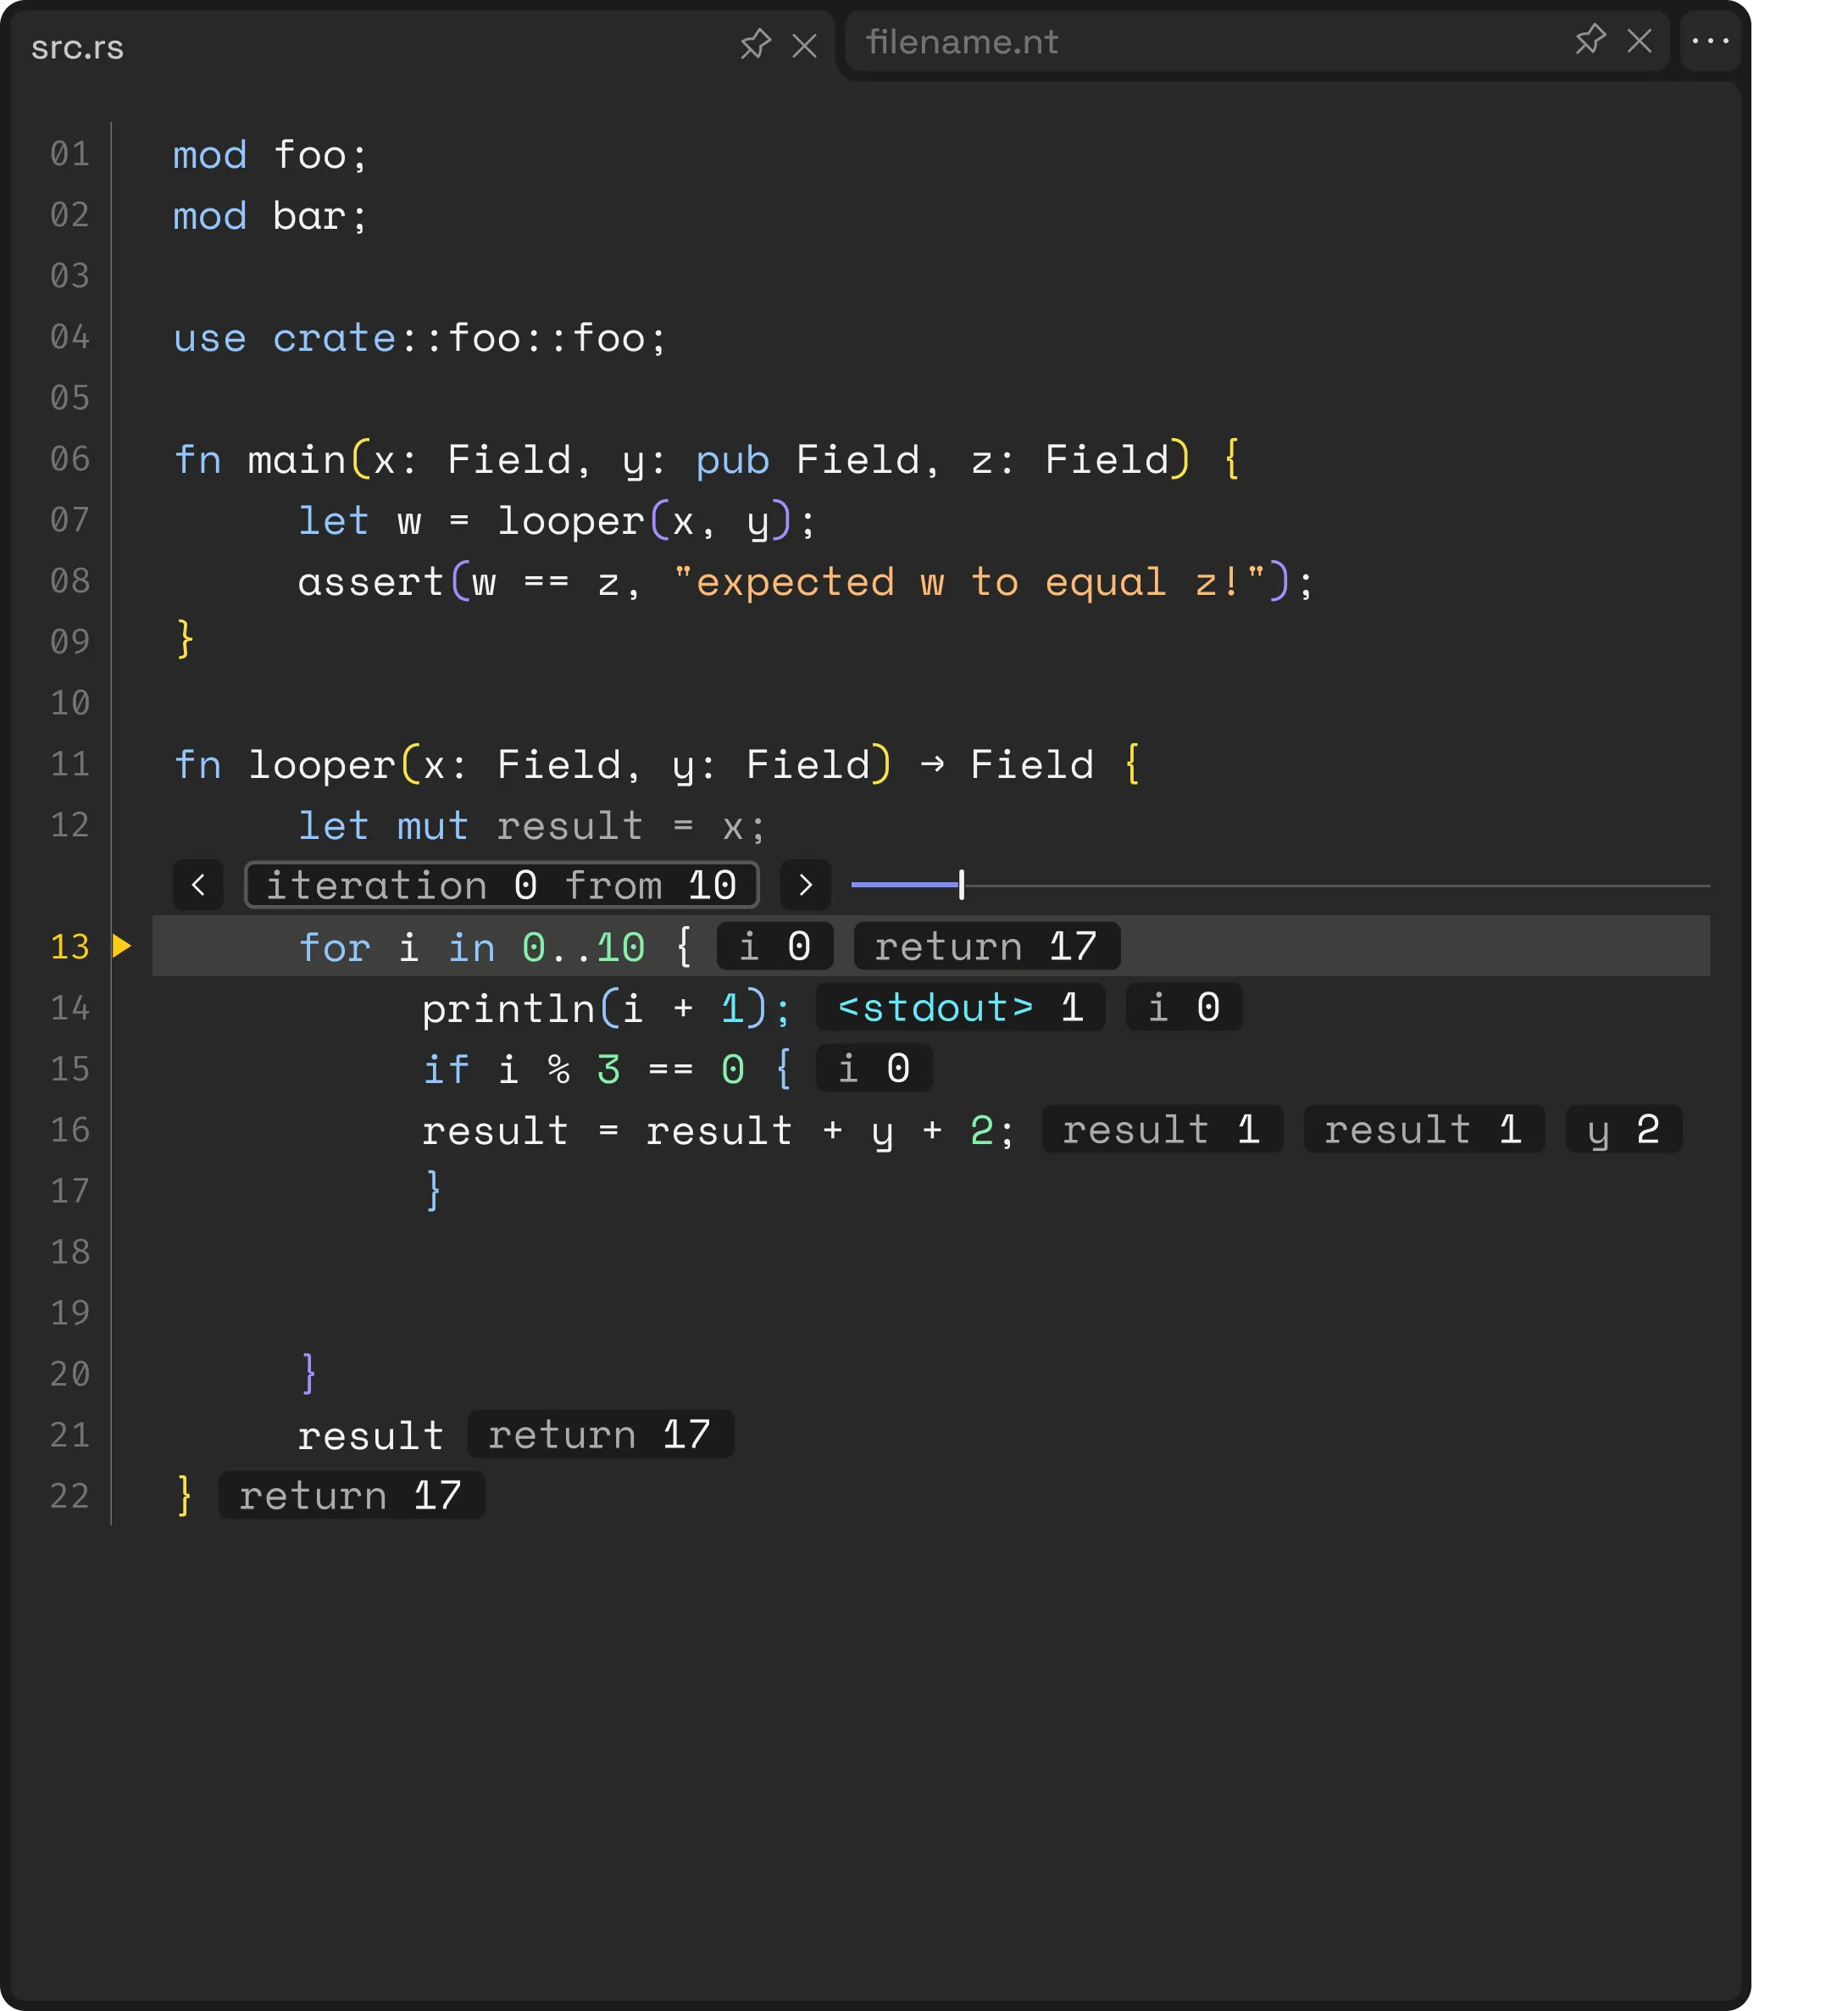
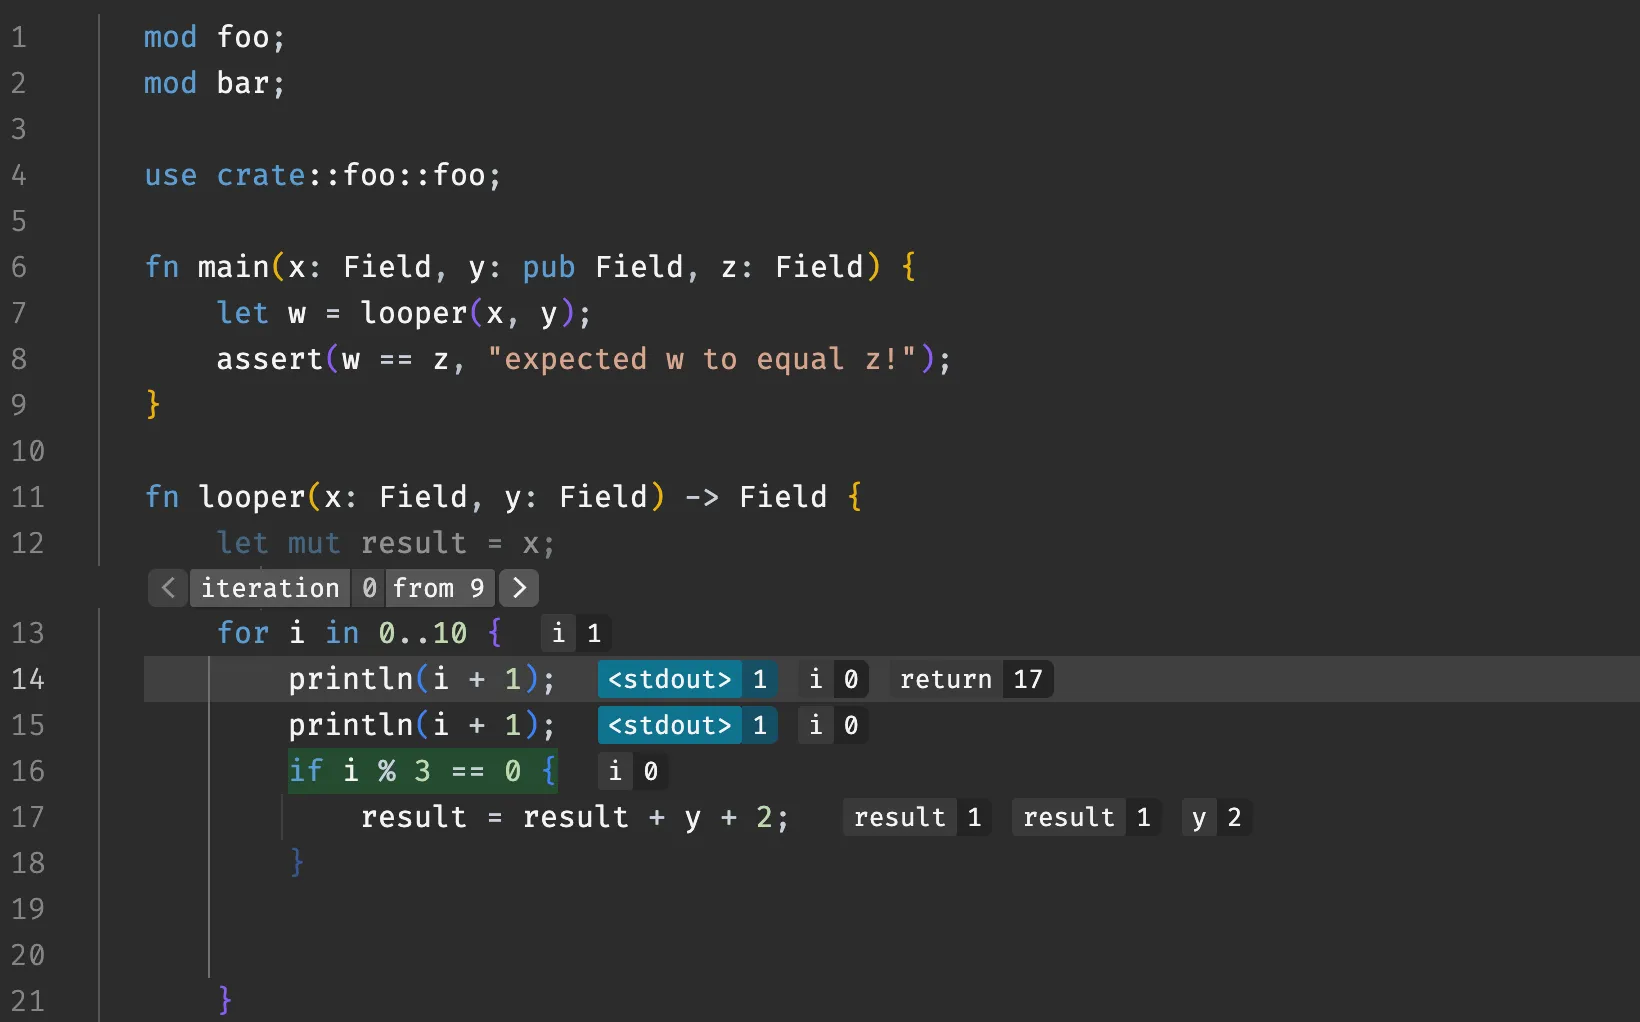
Rapidly gain deep understanding of every diff by inspecting how the code executes right within the code review workflow.
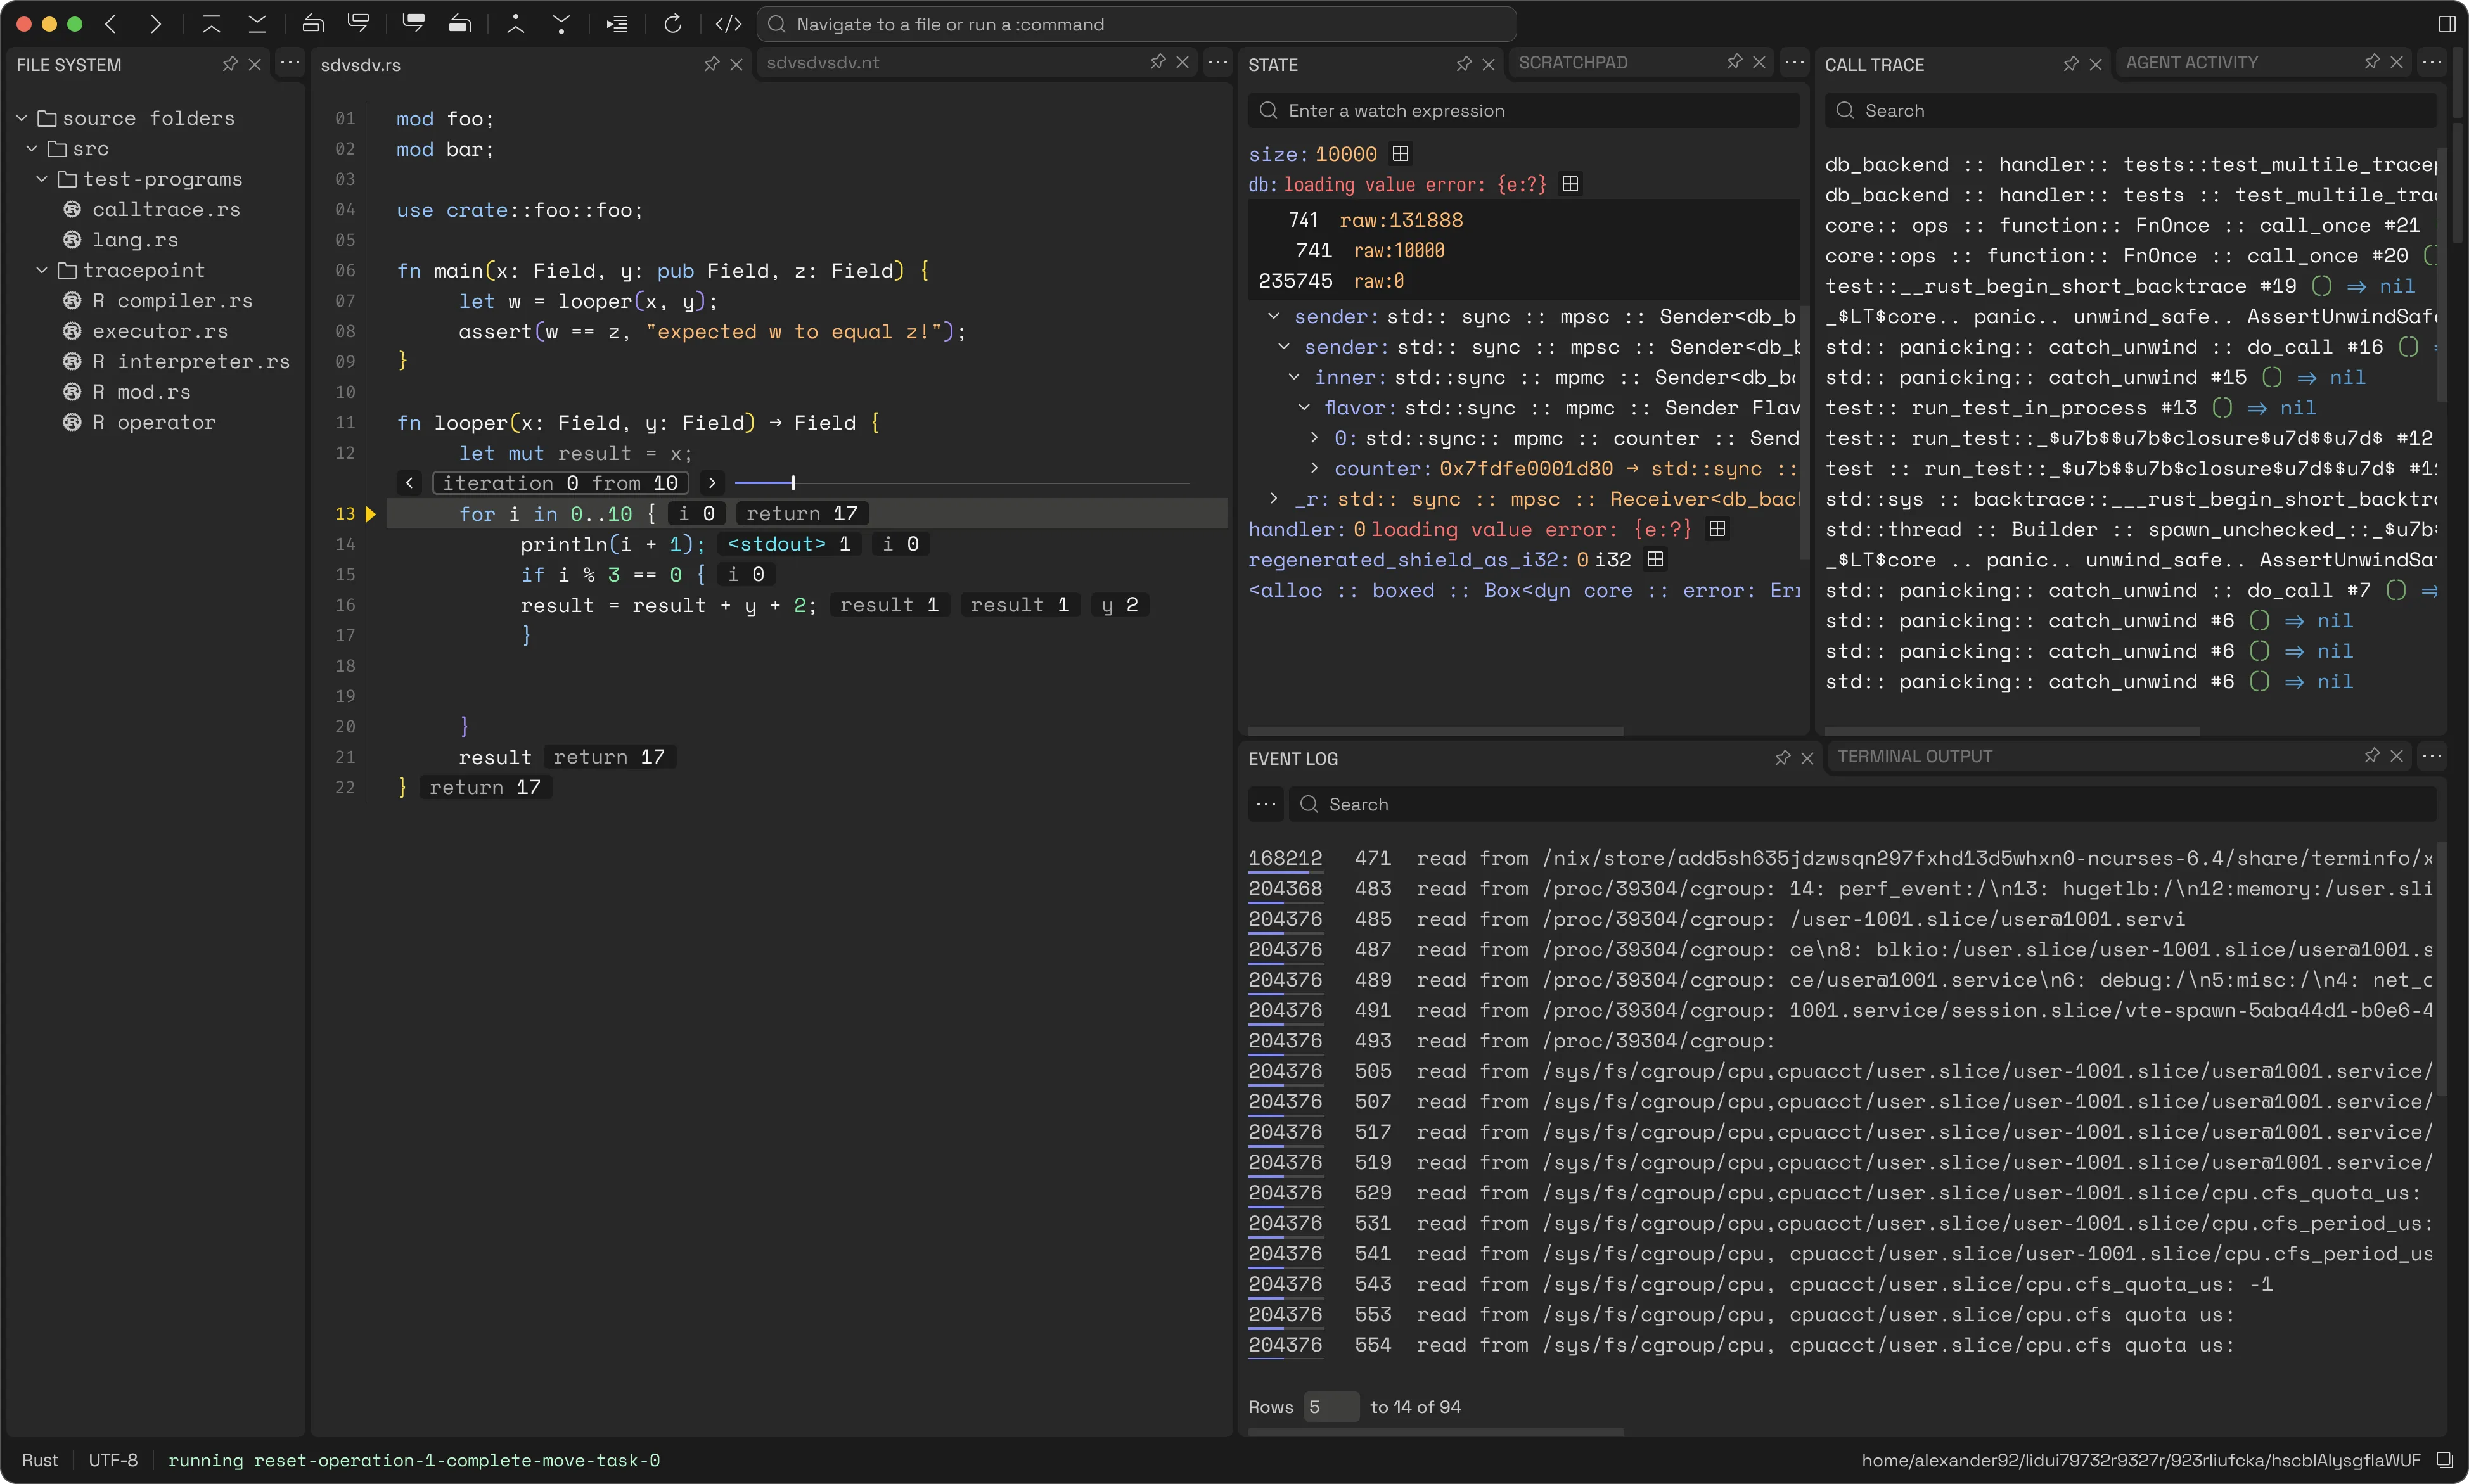
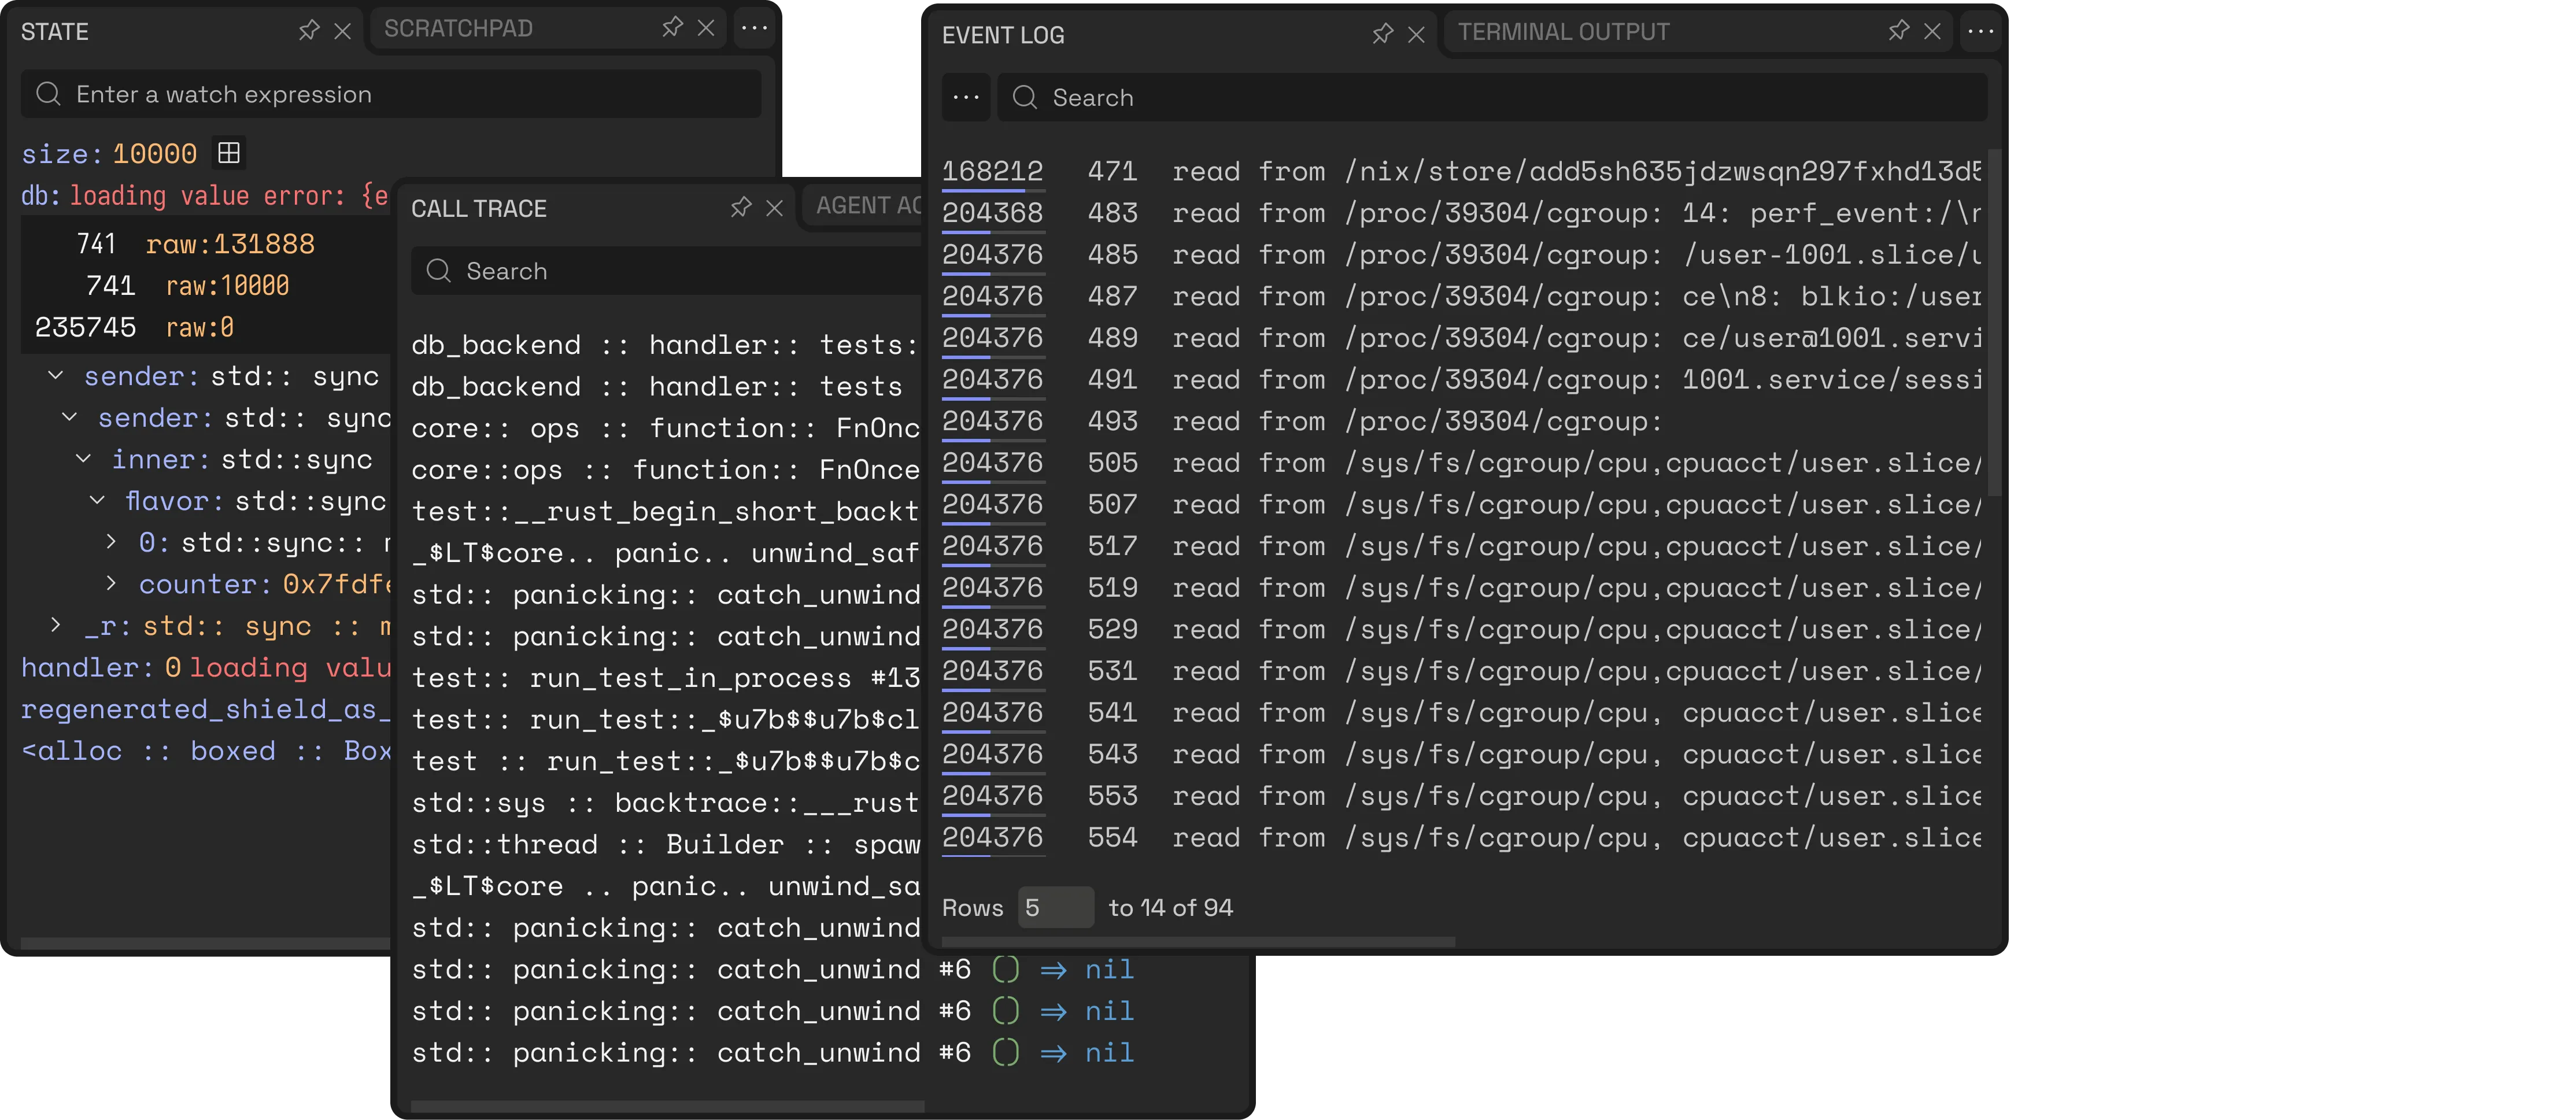
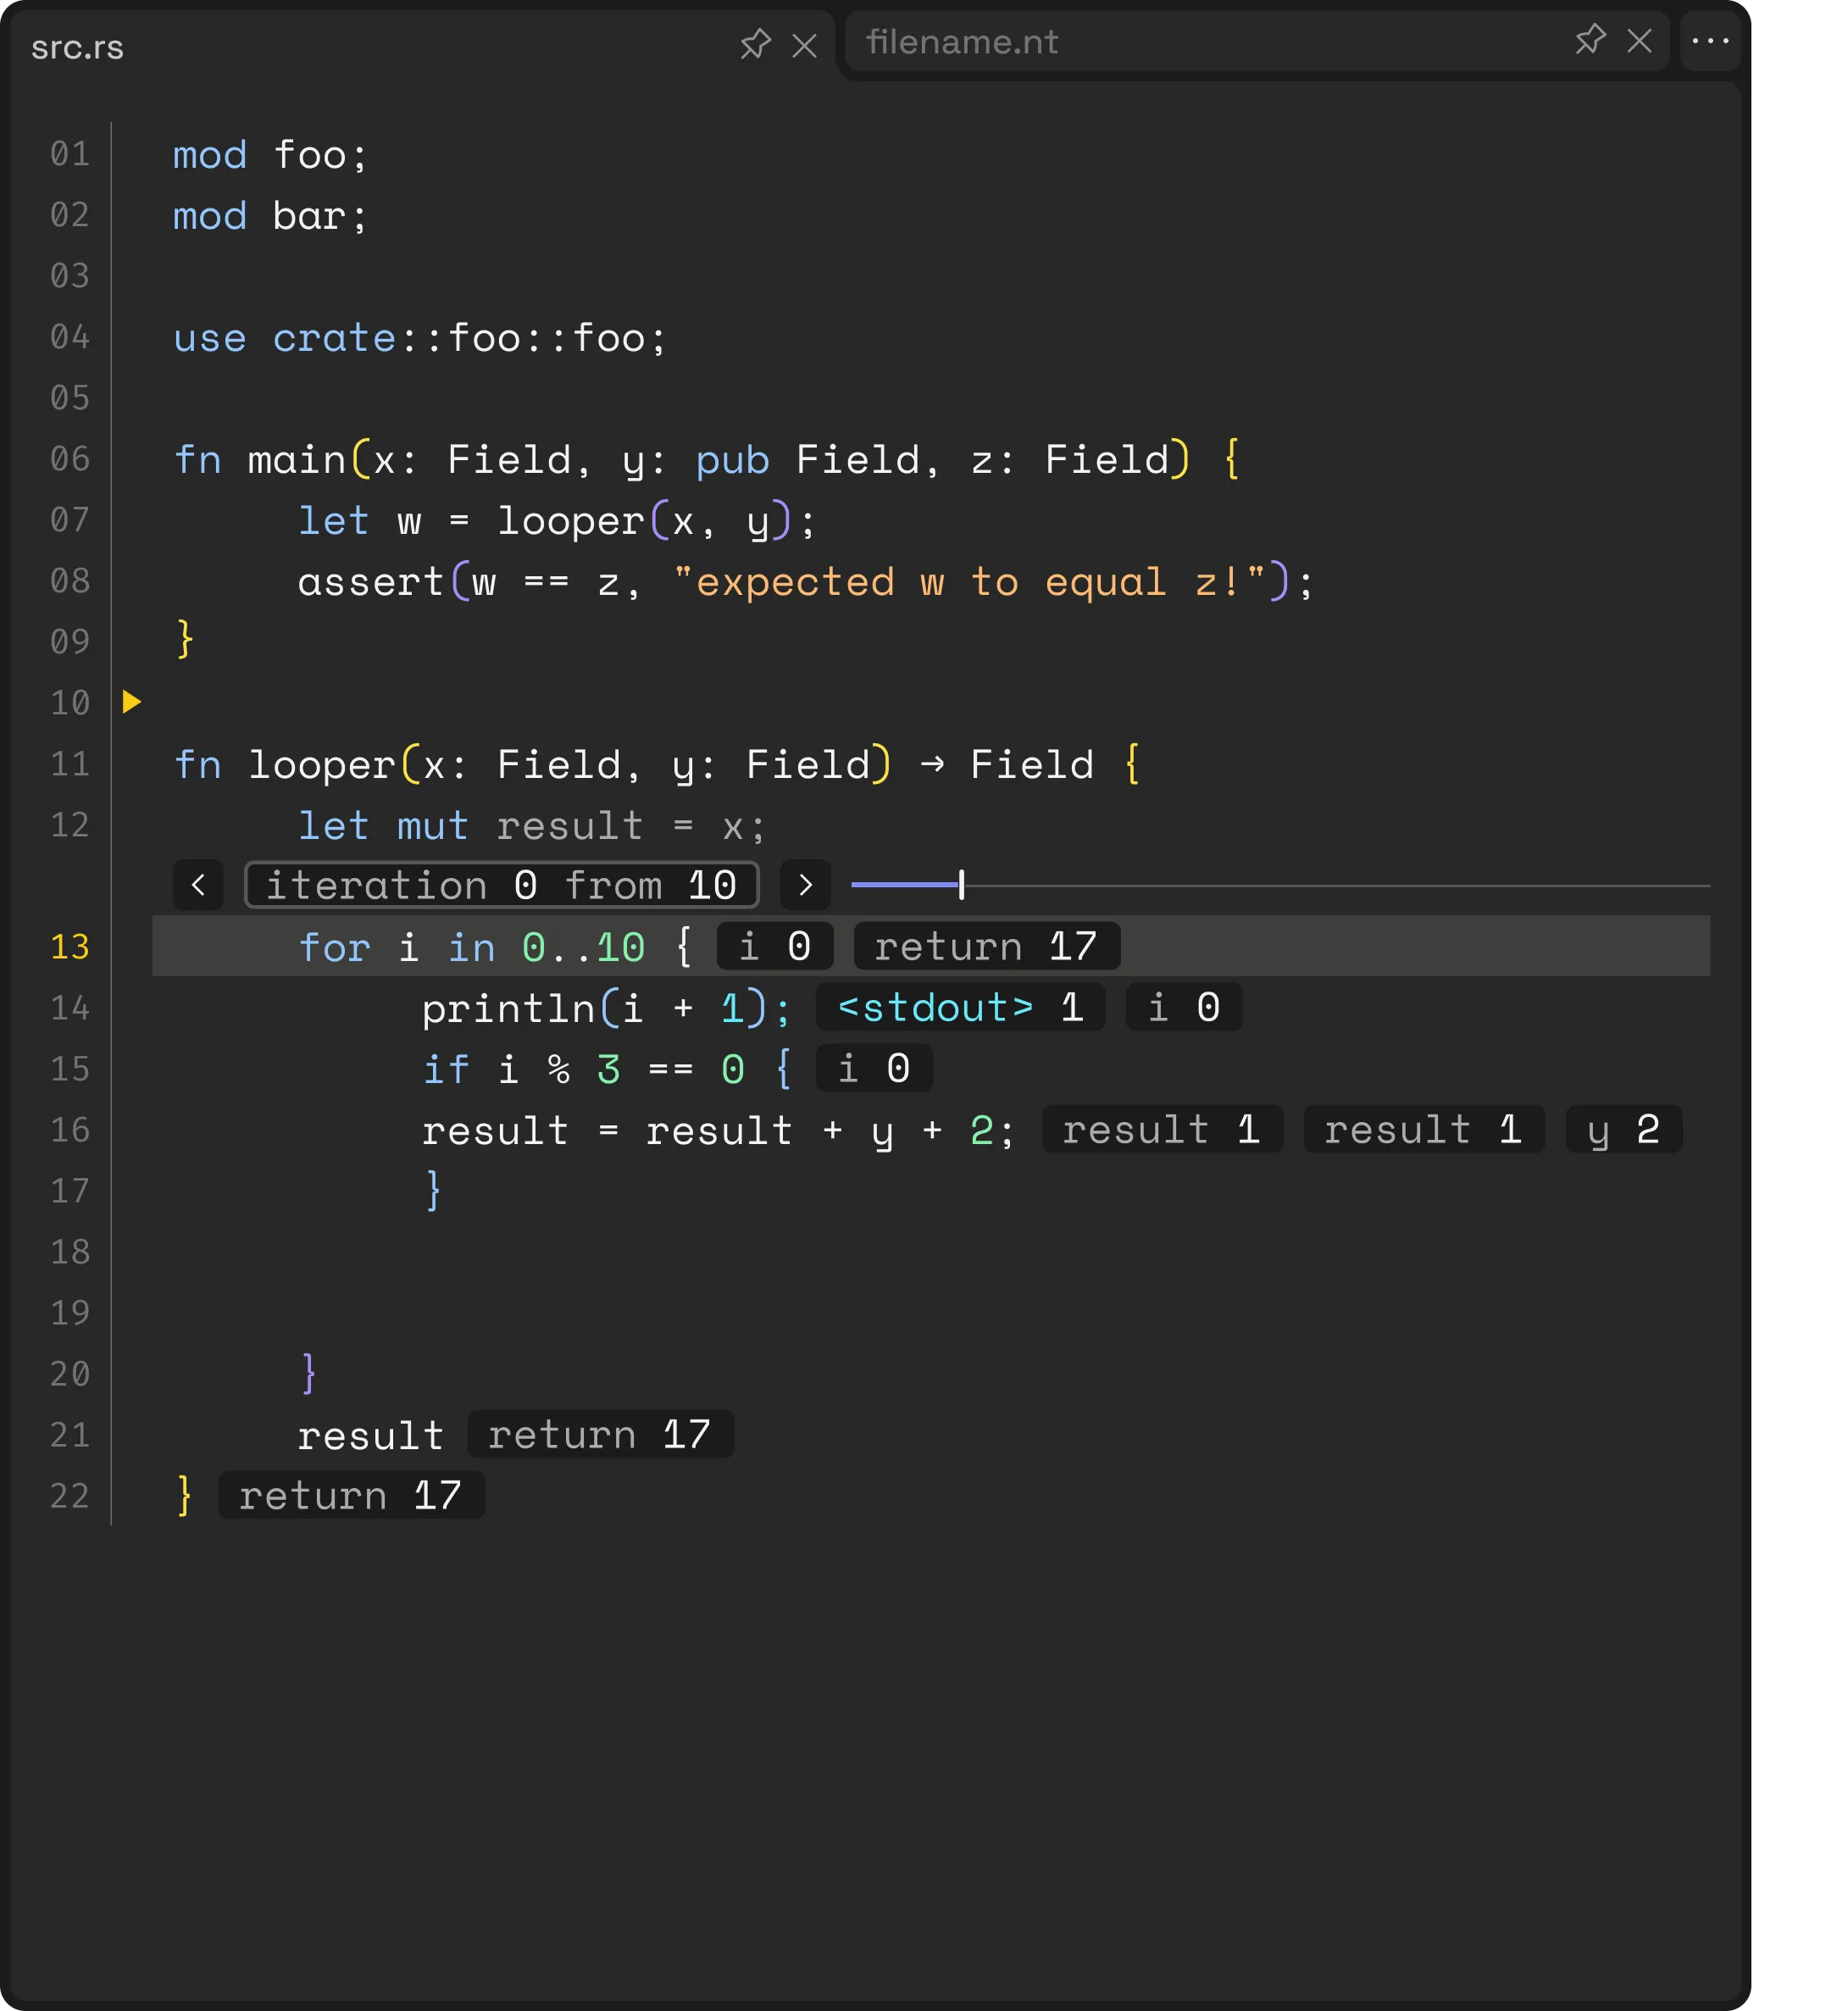
You and the agents have access to the most powerful time-traveling debugger when trouble strikes. Squash any bug in minutes.
Continuously record production with minimal overhead. Autonomous agents investigate real execution traces and stage verified red-to-green fixes before you get paged.
Supported languages
System support: Linux / macOS / Windows
Are you interested in a specific platform?  Contact us.
How It Works

One deterministic substrate.
Every language and OS.

CodeTracer provides open source front-ends and self-contained recorders
for a wide range of scripting languages, alongside a proprietary record
and replay engine for native code across Windows, macOS, and Linux.
Also compatible with Mozilla rr (Linux) and Microsoft TTD (Windows) trace recordings
The Product Family

One trace engine.
Five purpose-built platforms.

From production live recording to desktop debugging,
every CodeTracer product builds on deterministic execution traces.
Flagship Platform • homeostate.codetracer.com
CodeTracer Homeostate
Autonomous System Equilibrium & Self-Healing for Live Production
Continuous production execution recording with <5% overhead and in-memory PII redaction. When errors strike, autonomous agents investigate real execution traces, synthesize deterministic reproduction tests, and stage verified red-to-green fixes before you get paged.
CodeTracer Homeostate Console
Hosted CI Recording • In-Browser Replay
Turn test failures into instant replay links attached directly to pull request checks. Click any failure to step backwards and forwards through the exact execution trace directly in your browser with zero local setup or reproduction needed.
CodeTracer CI
Code Review
The classic code review diff enriched with live execution data. Inspect runtime variable values and verify branch coverage across every modified line directly in GitHub and GitLab.
CodeTracer DeepReview
IDE Extension
Omniscient time-travel debugging inside your everyday editor. Step backwards and forwards, inspect complete variable histories, and jump straight to the source expression that mutated any value.
CodeTracer for VS Code
Desktop • Cloud • TUI
Deterministic debugging everywhere: native high-performance Desktop GUI, zero-install web IDE at ide.codetracer.com, and lightning-fast terminal UI (TUI) for remote servers and SSH sessions.
CodeTracer Desktop, Cloud and TUI

Choose the plan that fits your business needs

All plans include both CodeTracer’s time-travel debugger and DeepReview runtime-enhanced code review.

Free

Free for everyone

For individuals getting started

Access to CodeTracer Desktop

Access to CodeTracer for VS Code

Unlimited use for OSS languages (Python, Ruby, Noir and Stylus)

Analyze 5 native code traces per day (C/C++, Rust, ...)

Pro

$199 /annually

For professionals and teams

Unlimited use of CodeTracer Desktop and CodeTracer for VS Code for all languages

10 GB of cloud storage

100 CPU minutes of cloud replay time

100 CPU minutes of cloud replay

Enterprise

Enterprise

For collaborative use at scale 

Org Single Sign On

Access control

Data retention controls

Priority Support

Training

Free

Free for everyone

For individuals getting started

Access to CodeTracer Desktop

Access to CodeTracer for VS Code

Unlimited use for OSS languages (Python, Ruby, Noir and Stylus)

Analyze 5 native code traces per day (C/C++, Rust, ...)

Pro

$19 /monthly

For professionals and teams

Unlimited use of CodeTracer Desktop and CodeTracer for VS Code for all languages

10 GB of cloud storage

100 CPU minutes of cloud replay time

100 CPU minutes of cloud replay

Enterprise

Enterprise

For collaborative use at scale 

Org Single Sign On

Access control

Data retention controls

Priority Support

Training

FAQ

This section covers the most frequently asked questions to give you clarity.
How does CodeTracer record production runs with under 5% CPU overhead?

CodeTracer native recording captures only non-deterministic inputs such as system calls, thread scheduling, synchronization ordering, and external I/O into bounded circular ring buffers. Deterministic execution itself is reconstructed during replay rather than serialized to disk, ensuring minimal CPU overhead (<5%) and zero runaway storage growth.

How do reviewers and AI agents replay CI failures in the browser?

CodeTracer CI attaches deterministic replay links directly to your GitHub and GitLab pull request checks. Clicking any link opens our web environment at ide.codetracer.com, allowing teammates and autonomous agents to step backwards and forwards through the exact execution trace with full variable history and zero local reproduction.

What is CodeTracer Homeostate and how does autonomous self-healing work?

CodeTracer Homeostate observes live production execution down to the variable. When an incident or unhandled exception strikes, autonomous agents perform a trace autopsy, construct a deterministic reproduction test (RED), synthesize a verified fix, and prove zero regressions (GREEN) before staging a ready-to-merge pull request.

How are privacy and sensitive data (PII) protected in recorded traces?

CodeTracer implements in-memory, capture-time PII redaction. Passwords, auth tokens, session headers, and configurable regex patterns are sanitized in memory before trace packets are committed to buffers or disk, preventing sensitive customer credentials from ever persisting in traces or cloud storage.

Which languages and operating systems are supported today?

CodeTracer provides open source, self-contained front-ends and recorders for scripting languages including Python, Ruby, JavaScript, and PHP, alongside a proprietary record and replay engine for native code (C, C++, Rust, Zig, Nim) across Linux, macOS, and Windows. It is also compatible with Mozilla rr (Linux) and Microsoft TTD (Windows) traces.

Can I use CodeTracer with my existing IDE and autonomous AI agents?

Yes. CodeTracer offers extensions for VS Code, standalone Desktop GUI, and high-speed terminal UI (TUI) environments. Through standard Model Context Protocol (MCP) endpoints, autonomous coding agents (powered by Agent Harbor or external LLMs) can query runtime variables, inspect call trees, and verify fixes automatically.